Thrifty
A local-only finance tracker that syncs bank, brokerage, and credit card accounts to track net worth, spending, and portfolio allocation.
Details
Thrifty is the successor to Matcha, a budgeting app I built in 2016. Matcha used Plaid, which kept breaking as banks tightened API access, and stored everything in a cloud database. The core lesson: own your data pipeline and keep the data local.
Every number in the screenshots is fake (Numbers are illustrative.)
What it tracks
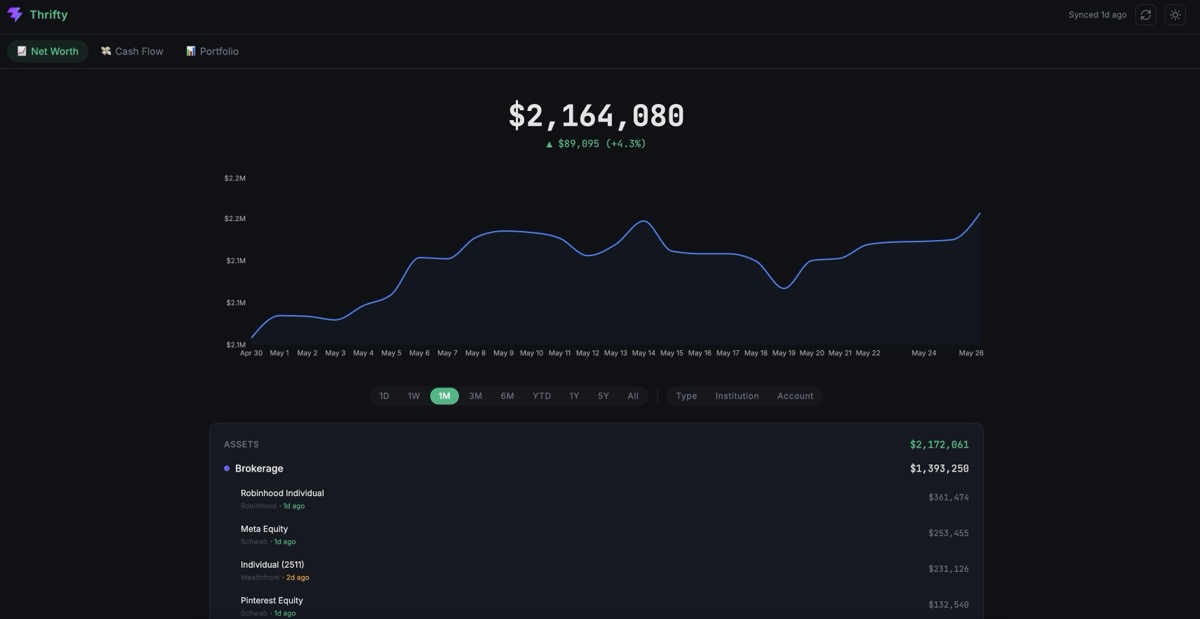
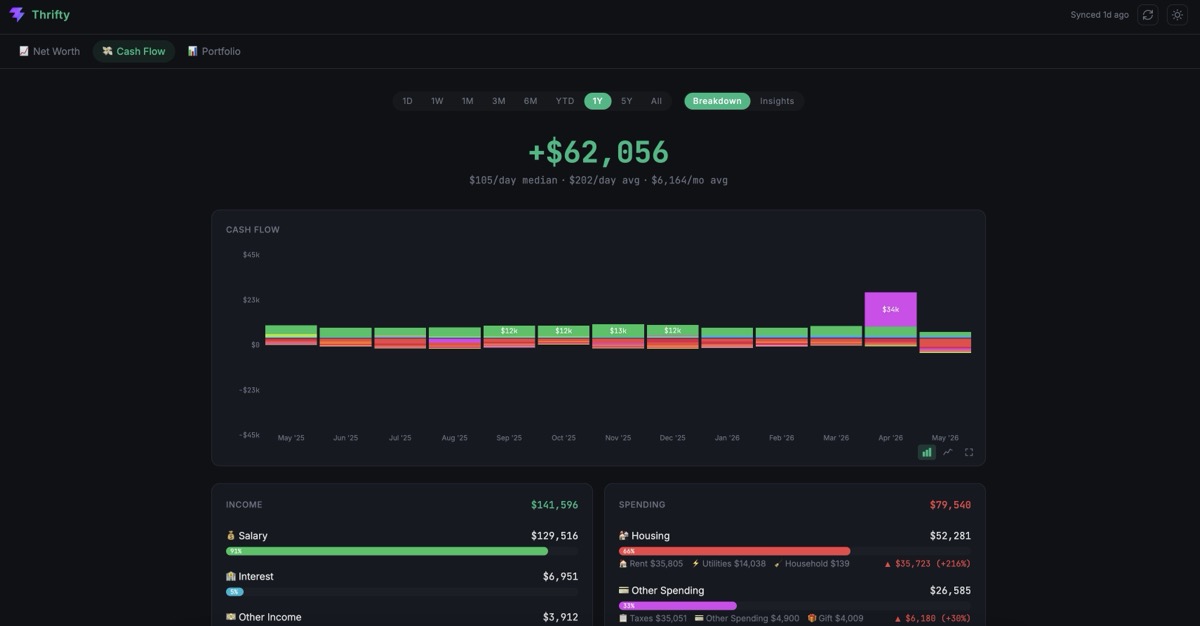
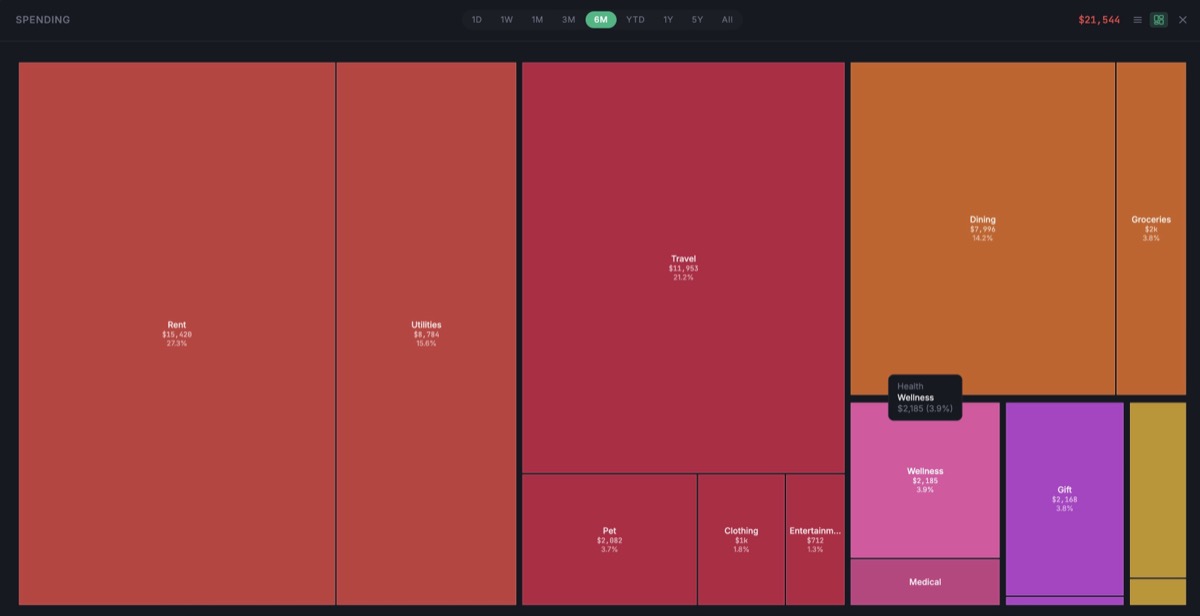
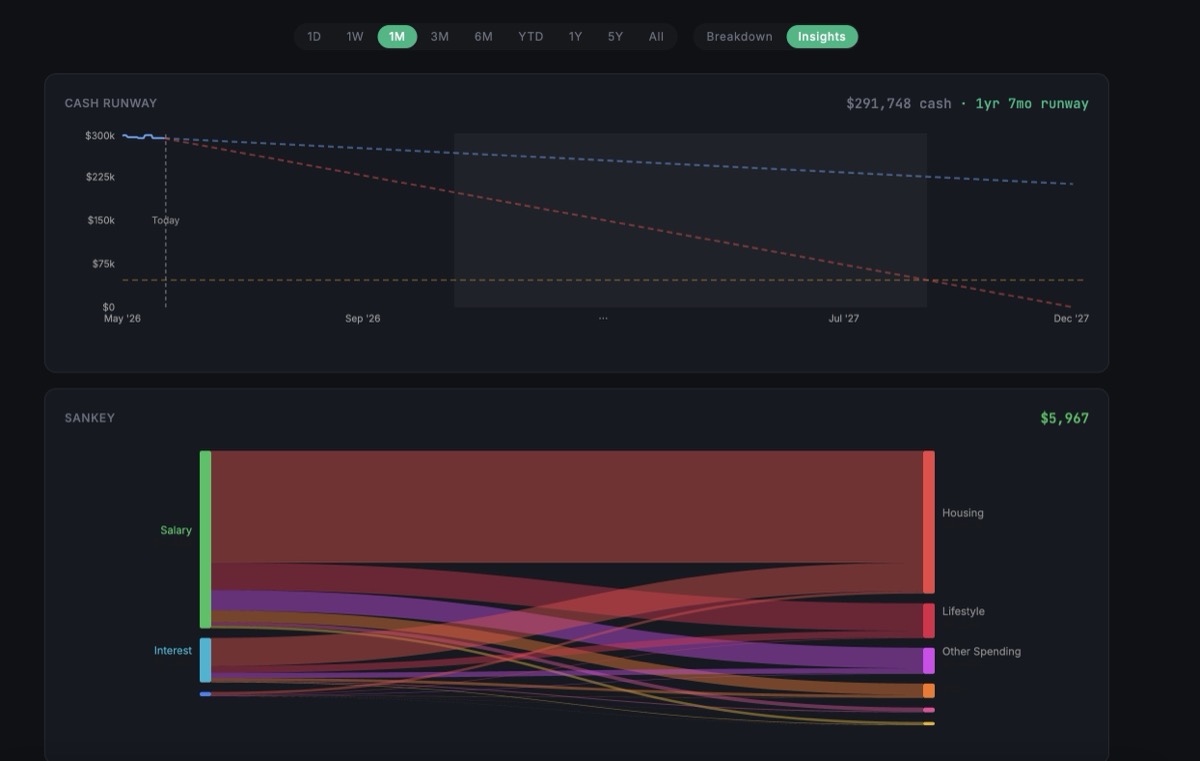
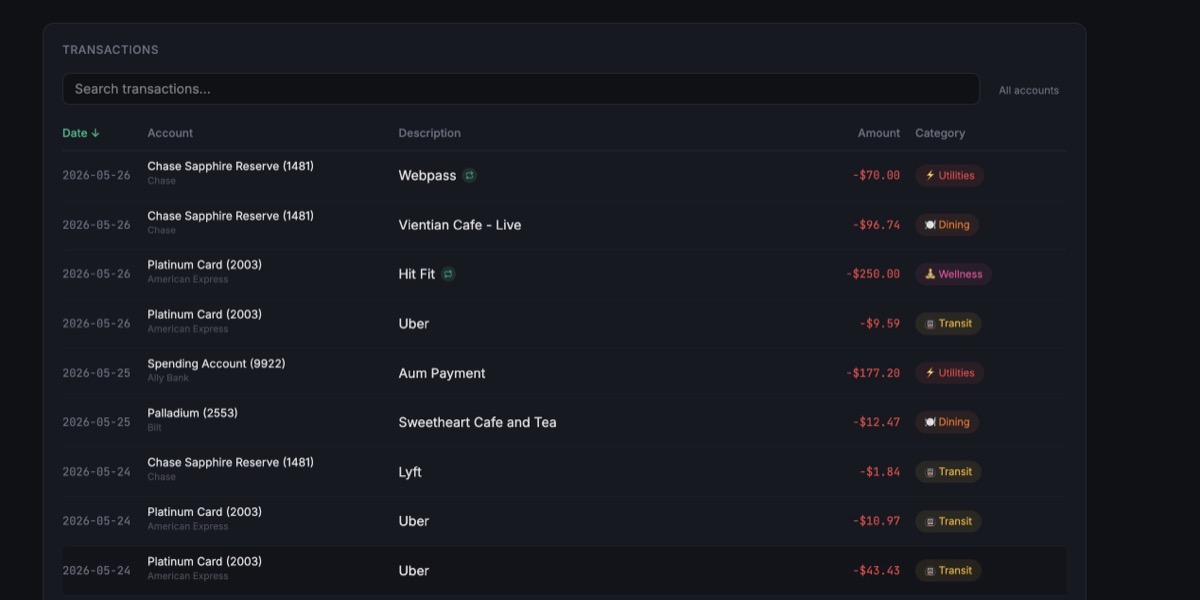
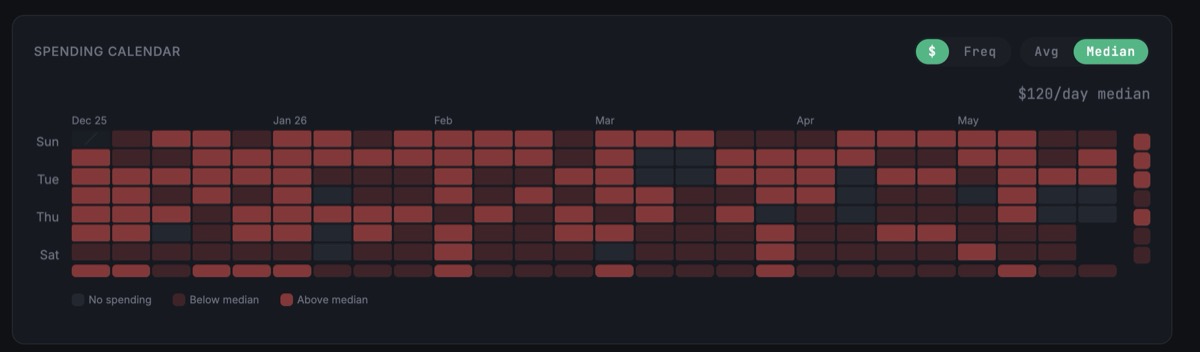
Three views: net worth over time, cash flow breakdown, and portfolio allocation. Cash flow has the most depth- spending by category, a waterfall chart of income vs. expenses, a spending calendar, a Sankey chart, and a treemap. Transactions are categorized via a deterministic rules file.
Data syncs from SimpleFIN Bridge (banks and credit cards), SnapTrade (brokerages and retirement accounts), and a Bilt Chrome extension for the Bilt card. Amazon orders get their own treatment- a Chrome extension scrapes the payments page, matches each transaction to its order items, and imports them with line-item detail so “Amazon.com” becomes the actual things I bought.
Amazon item categorization uses a local embedding model (qwen3-embedding:0.6b via Ollama) as a centroid classifier- it embeds known labeled items to build per-category centroids, then classifies new items by nearest cosine distance. No API costs, runs offline.
Stack
Python/FastAPI backend with SQLite, React 19 + TypeScript frontend. All the finance math lives in an isolated finance/ module with 50 unit and property-based tests- kept separate from the charts so the logic is testable without rendering anything.
Source on GitHub.
Gallery